
 October 30, 2026
 Business, Ecommerce, Hosting Performance
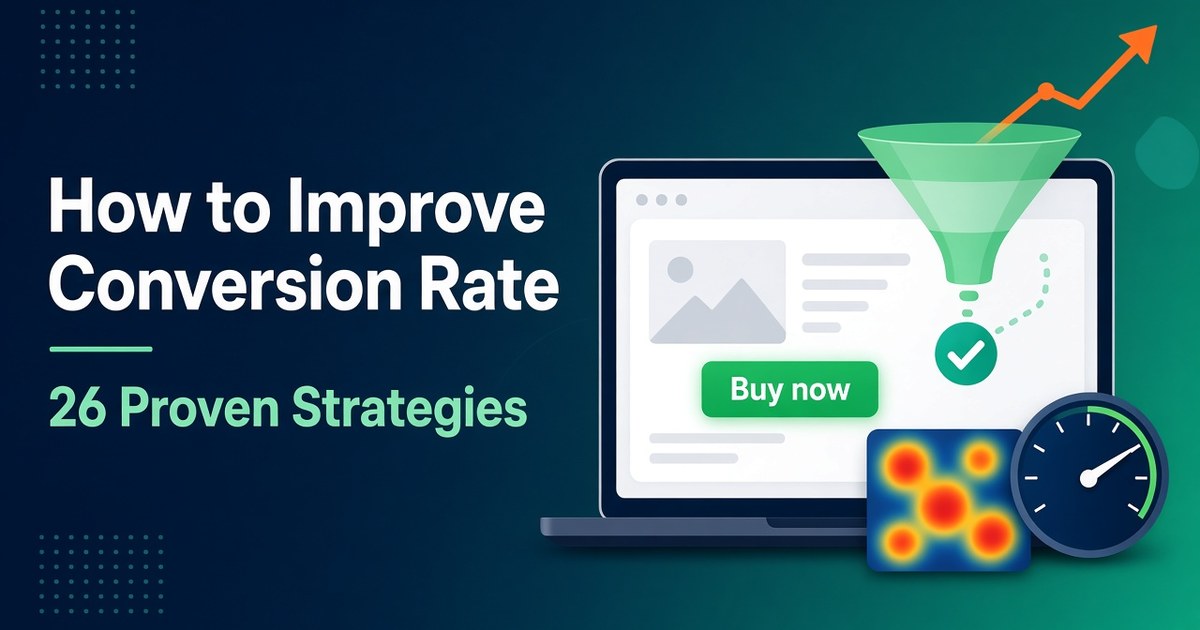
Short answer: To improve your conversion rate, first find where visitors drop off and why. Then fix the biggest problem, prove the fix worked, and repeat. In practice that means measuring with Google Analytics, watching real sessions in Microsoft Clarity, getting your Core Web Vitals into the “good” range, and removing friction from your forms and checkout. It also means attracting visitors who were likely to convert in the first place, which is where AI SEO for websites fits in, and knowing when it makes more sense to hire a CRO specialist than to do it all yourself.
This list is a sequence, not 26 unrelated tips. The strategies run in six stages: measure, diagnose, fix speed, fix the message, fix the action and trust, then prove it. Each one names the tool and the evidence behind it, and it flags where Canadian law rules out popular “conversion hacks.”
Your conversion rate is the percentage of visitors (or sessions) who complete the action you care about:
Conversion rate = conversions ÷ visitors × 100
Say a landing page gets 4,000 visitors in a month and 120 of them submit the quote form. That page converts at 3%.
There is no universal “good” number, because the rate depends on the action you’re measuring, the price and the traffic source. As a reference point, Unbounce’s 2024 Conversion Benchmark Report put the median landing-page conversion rate at 6.6% across more than 41,000 landing pages and 464 million visitors. Industry medians ranged from about 3.8% to 12.3%. Ecommerce checkouts are a different measure entirely: Baymard Institute’s cart abandonment research (updated September 2025) puts the average documented abandonment rate at 70.22%, averaged across 50 studies.
The benchmark that matters most is your own baseline from last month, broken down by device and channel. Strategies 1–5 get you that number.
Each tool answers a different question. Using them in this order stops you from guessing:
| Question | Tool | What it gives you |
|---|---|---|
| Where do people drop off? | Google Analytics 4 (funnel exploration) | The step with the biggest leak, by device and channel |
| Why do they drop off? | Microsoft Clarity (recordings, heatmaps) | Rage clicks, dead clicks, scroll depth, JavaScript errors |
| Is speed the cause? | Search Console Core Web Vitals report, PageSpeed Insights | Field data on LCP, INP and CLS for real visitors |
| Did the fix work? | A/B test, or a dated before/after comparison | Proof, or a clear “not yet” |
Every strategy below feeds one of these four questions.
Every important page needs one job: book a call, add to cart, request a quote. Track that action as an event in Google Analytics 4 and mark it as a key event. Google Analytics now uses “key event” for what it used to call a conversion, and keeps “conversion” for actions shared with Google Ads (Google Analytics Help).
Use Google’s recommended event names where they fit, such as generate_lead or purchase, so reports stay readable. Track secondary actions too, but don’t mark everything as a key event.
Before you change anything, write down the last 28 days of key-event rate for each important page, split by device and by channel (organic, paid, email, referral). A site-wide average hides the story: mobile may convert at half the desktop rate.
Unbounce’s benchmark data shows how much channel matters. It found email traffic converting at a 19.3% average on landing pages, far above other channels, and 82.9% of landing-page visits coming from mobile devices (as summarised by MarketingProfs, 2024).
In GA4, open Explore → Funnel exploration and add the steps a visitor takes to convert: landing page → product or pricing page → form or cart → thank-you page. GA4 funnels support up to 10 steps, open or closed funnels, segment comparisons and a breakdown by device category (Google Analytics Help).
Start with the single step that has the largest percentage drop. Fixing a 60% drop-off at the pricing page beats polishing a homepage headline.
Microsoft Clarity is free. Microsoft’s Clarity FAQ says there are no traffic limits and no sampling. You get session recordings, click and scroll heatmaps, and automatic flags for frustration signals. The script loads asynchronously, and Microsoft says it doesn’t slow your pages. Text-input fields are masked by default.
Link Clarity to GA4 through the built-in Google Analytics integration. Clarity then adds a “Clarity Playback URL” dimension in GA4, and your GA4 segments show up as filters inside Clarity. That link is what makes the evidence chain work: GA4 shows you the leaking step, and one click takes you to recordings of the people who leaked.
Know the limits before you rely on it. Recordings are kept for 30 days unless you favourite them. Heatmaps last up to nine months. Clarity records up to 100,000 sessions per project per day. Microsoft also says Clarity must not be used on sites aimed at people under 18, and that you must tell visitors about Clarity’s cookies.
Analytics consent isn’t only a legal box to tick. If you get it wrong, your data breaks. Clarity requires explicit consent signals for visitors from the European Economic Area, the UK and Switzerland. Without them, Microsoft notes, sessions can fragment and recordings become harder to read (Clarity FAQ).
Canadian sites have their own rules. Quebec’s Law 25 added a rule that any technology able to identify, locate or profile a person must be turned off by default, with the person told how to turn it on (Act respecting the protection of personal information in the private sector, s. 8.1). Whether your particular analytics setup counts as profiling is a question for privacy counsel. The practical step is the same either way: use a consent management platform that signals consent to both GA4 and Clarity, and test that it works on mobile. A cookie banner that pops in late can also hurt your CLS score, which ties into strategy 12.
This section is general information, not legal advice. Check with a privacy professional how these rules apply to your site.
Don’t watch recordings at random. In Clarity, filter to the page or funnel step you found in strategy 3, then filter by rage clicks (repeated rapid clicks on one spot), dead clicks (clicks that do nothing), quick backs (people who leave a page almost immediately) and JavaScript errors (Clarity FAQ).
Watch 20–30 of these sessions and note every pattern you see more than twice: an image people expect to be a link, a coupon field that sends them off hunting for codes, a “Continue” button hidden by the mobile keyboard, a price that changes at the shipping step.
Clarity’s Copilot can summarise recordings and heatmaps for you. Treat those summaries as leads to check, not conclusions. Microsoft itself notes that its AI insights should be verified (Clarity FAQ).
Clarity’s heatmaps show where people click and how far down they scroll, and you can view them separately for desktop, tablet and mobile. Two questions matter here:
Recordings can’t tell you what a hesitant buyer was worried about. Words can:
Group the answers by theme. The top three objections become your copy and FAQ brief for strategies 14 and 24.
Open the Core Web Vitals report in Search Console or run the page through PageSpeed Insights. Look at the field data, which measures real visitors, rather than only the lab score. Google’s thresholds, measured at the 75th percentile of page loads, are (web.dev):
| Metric | What it measures | “Good” threshold |
|---|---|---|
| Largest Contentful Paint (LCP) | How quickly the main content appears | 2.5 seconds or less |
| Interaction to Next Paint (INP) | How quickly the page responds to taps, clicks and key presses | 200 milliseconds or less |
| Cumulative Layout Shift (CLS) | How much the layout jumps around | 0.1 or less |
INP replaced First Input Delay as a Core Web Vital on March 12, 2024 (web.dev). If an older guide tells you to fix “FID,” it’s out of date.
Does this affect SEO? Partly. Google says Core Web Vitals are used by its ranking systems, but that good scores don’t guarantee top rankings, and that chasing a perfect score purely for SEO may not be the best use of your time (Google Search Central). Speed matters more for conversions than for rankings, as the next stage shows.
Here’s the evidence that speed affects conversions. In Deloitte’s 2020 study with Google, Milliseconds Make Millions, 37 brands and about 30 million sessions were analysed. A 0.1-second improvement in mobile site speed was associated with 8.4% more conversions for retail sites and 10.1% more for travel sites. That’s a correlation across brands, not a controlled test.
Controlled tests exist too. Vodafone ran an A/B test in which a 31% better LCP produced 8% more sales (web.dev case study, 2021). redBus, a bus-ticketing site, improved INP on its search page by 72% and reported a 7% increase in sales (web.dev case study).
Google’s web.dev team says about 40% of sites in the Chrome UX Report don’t meet the LCP threshold. On 73% of mobile pages, the element that counts for LCP is an image (web.dev, 2024). So the fixes usually involve the hero image:
fetchpriority="high" to that image.Google’s full LCP optimization guide goes step by step through each part of the load.
Poor INP usually comes from too much JavaScript running on the main thread. Chat widgets, A/B testing scripts, ad tags and tag-manager clutter are common causes. Google’s recommendations (web.dev) are to break up long tasks, remove JavaScript you don’t need, and prune old tags from your tag manager.
The redBus fixes are a good template (web.dev). The team limited how often a scroll handler ran and loaded 10 results per batch instead of 30, which brought slow interactions down from roughly 870–900 ms to 350–370 ms. They also stopped re-rendering the interface on every keystroke in form fields.
Google’s guide to optimizing INP covers the techniques in depth. A quick audit: list every third-party script on your checkout and lead-form pages. For each one, ask, “Would we notice tomorrow if this was gone?”
Layout shifts cause mis-taps, such as hitting “Remove item” instead of “Checkout.” According to web.dev, 66% of pages have at least one image without set dimensions (web.dev). Fixes:
width and height attributes, or a CSS aspect-ratio, on every image and video.transform, not properties that change layout, like top or height.More fixes are in web.dev’s CLS optimization guide.
Front-end fixes only go so far if the server is slow or far from your buyers. If most of your customers are Canadian, servers in Canada cut the distance every request has to travel. This explainer on how server distance affects load times and search performance walks through the trade-offs, and our Canadian web hosting guide compares what to look for in a provider.
On WordPress, look for a plan with server-level caching, a CDN, free SSL and a staging site. Staging is handy for conversion work, because you can try a checkout change on a copy before real customers see it. Our overview of managed WordPress hosting in Canada explains what those plans usually include. For more on the metrics themselves, see this walkthrough of Core Web Vitals and how they relate to rankings.
A visitor should be able to answer three questions within a few seconds of landing: What is this? Is it for me? Why choose this over the alternatives? If your hero headline is a slogan (“Elevate your digital journey”), it answers none of them.
Write it in plain language. Unbounce’s benchmark analysis found that landing pages written at a 5th–7th grade reading level converted at 11.1%, about twice the 5.3% rate for professional-level writing (Unbounce via PR Newswire, 2024). Plain language respects the reader’s time.
Someone who clicks an ad for “same-day furnace repair in Calgary” and lands on a generic homepage leaves. Each campaign, email and high-intent search query should land on a page that repeats its promise: the same offer, the same wording, the same location.
Check this in GA4. Compare the key-event rate by landing page and source/medium. A paid campaign with a high click-through rate but a low on-site conversion rate usually means the page doesn’t match the promise.
The cheapest conversion gain is often upstream: bring in visitors whose question your page actually answers. That’s what the term should mean in practice. Use AI tools to research what buyers ask and to plan content around it, then make the pages genuinely useful. Don’t use them to mass-produce thin articles.
Google’s own guidance keeps this simple:
To see whether AI-referred visitors convert, Clarity’s FAQ says it can identify traffic from AI platforms such as ChatGPT, Claude, Gemini and Perplexity as its own channel. Traffic from Google’s AI Overviews can’t be separated from regular Google search (Clarity FAQ). For a deeper look at earning visibility in AI answers, read our guide on how to get cited by AI.
People skim. Nielsen Norman Group’s eye-tracking research found that readers often scan in an F-shaped pattern. Its 2017 follow-up noted that this pattern shows up mostly on poorly formatted, text-heavy pages. That’s the useful part: good formatting changes how people read.
Competing buttons split the visitor’s focus. Pick the one action from strategy 1 and make it the visually dominant button. Repeat it at natural decision points, such as after the pricing table and after the FAQ.
Label the button with the outcome: “Get my free quote,” “Start my 30-day trial,” “Book a 15-minute call.” Avoid “Submit.”
Small, crowded tap targets cause mis-taps and rage clicks. WCAG 2.2 sets a minimum target size of 24 × 24 CSS pixels, or enough spacing around smaller targets (W3C, Success Criterion 2.5.8). Treat that as the floor. Primary buttons on mobile should be comfortably larger.
Each field is a small cost to the visitor. Baymard Institute’s checkout research finds that an ideal checkout needs only 12–14 form elements, but the average US checkout shows 23.48 (Baymard Institute). The same applies to lead forms.
Go through your form with whoever handles the leads and ask about each field: “What do we do with this before the first conversation?” If the answer is “nothing,” delete it, or ask for it later. Combine first and last name where you can. Make phone optional unless you really call every lead.
In Baymard’s data (US shoppers, excluding people “just browsing”), 40% of people who abandoned a purchase cited extra costs like shipping, taxes and fees, and 12% said they couldn’t see or calculate the total up front (Baymard Institute). Surprise fees kill conversions.
In Canada they’re also a legal risk. The Competition Act names drip pricing — advertising a price that can’t be reached because of extra mandatory fees — as deceptive marketing. Amendments in June 2024 clarified that only fixed charges imposed by government on the purchaser, such as sales tax, can be left out of the advertised price (Competition Bureau Canada).
Show mandatory fees in the first price people see. Add a shipping or tax estimator on the product or cart page instead of revealing costs at the last step.
In the same Baymard data, 18% of abandoners left because the site wanted them to create an account, 17% because checkout was too long or complicated, and 9% because there weren’t enough payment methods (Baymard Institute).
Let people check out as guests. Offer account creation after the purchase (“Save your details for next time?”). Offer the payment methods your customers actually use, such as digital wallets, and check your checkout provider’s options for Canadian payment methods too. Baymard estimates that large ecommerce sites could see a conversion rate increase of 35.26% from better checkout design alone. Its checkout usability research is worth browsing before any redesign.
Clarity’s dead clicks and rage clicks often bunch up on a “Place order” button that does nothing because a field above it is invalid and the error is off-screen. Fix the pattern:
Trust is a conversion factor, not just branding. In Baymard’s data, 19% of abandoners said they didn’t trust the site with their credit card details (Baymard Institute). Put proof where the hesitation happens, which is beside the price, the form and the payment button:
Be careful with “was $99, now $49” price anchoring. The Competition Bureau says a “regular price” has to be genuine, and businesses must be able to prove it. It has to pass a volume test (more than 50% of sales at that price or higher within a reasonable period, usually a year) or a time test (offered in good faith at that price for a substantial period) (Competition Bureau Canada: ordinary selling price). Keep records of your prices and promotion dates.
Popups can collect email addresses, but full-screen interruptions put people off. Google’s guidance on intrusive interstitials and dialogs recommends banners that take up a small part of the screen over overlays that cover the whole page, and warns that intrusive dialogs can erode trust and hurt search performance.
Two Canadian rules apply here:
Real urgency, like a genuine sale end date or holiday shipping cut-off, is fine.
A/B testing is the gold standard for proving a change caused a lift, but it needs volume. Here’s an illustration we calculated with the standard two-proportion sample-size formula (95% confidence, two-sided, 80% power). It shows the visitors needed per variant:
| Baseline conversion rate | Lift you want to detect (relative) | Visitors needed per variant |
|---|---|---|
| 2% | +10% (2.0% → 2.2%) | about 80,700 |
| 2% | +20% (2.0% → 2.4%) | about 21,100 |
| 2% | +30% (2.0% → 2.6%) | about 9,800 |
| 3% | +20% (3.0% → 3.6%) | about 13,900 |
| 5% | +20% (5.0% → 6.0%) | about 8,200 |
Double these for a two-version test. A page with 10,000 visitors a month and a 2% conversion rate would need about four months to reliably detect a 20% lift. You can check your own numbers with Evan Miller’s free sample-size calculator.
What this means in practice:
Many small sites can improve conversion rate on their own with strategies 1–25 and free tools. Bringing in a conversion rate optimization (CRO) specialist starts to pay off when one or more of these is true:
| Signal | Do it yourself | Consider hiring |
|---|---|---|
| Traffic to key pages | Too low for A/B tests (see strategy 26), so fix obvious issues and compare before/after | Enough to run several valid tests per quarter, so a specialist’s test planning pays off |
| Tracking | GA4 key events and Clarity are set up and you trust the numbers | Numbers conflict across tools, events double-fire, or consent setup is unclear |
| Value per conversion | Low-ticket, where small lifts are worth little in dollars | High-ticket or high-volume, where a 5% lift covers a specialist’s fee many times over |
| Bottleneck | You know what’s wrong and just need time to fix it | You’ve fixed the obvious issues and don’t know what to test next |
| Development capacity | Your CMS lets you make changes directly | Changes need developers, and someone has to write clear specs and QA them |
Before you hire, ask any candidate:
Be wary of guaranteed percentage lifts. Nobody can honestly promise a result before they’ve seen your data.
| What you see | Most likely cause | Start with |
|---|---|---|
| High bounce on mobile only | Slow LCP, a layout that jumps, or a missing mobile call to action | 9, 10, 12, 17 |
| Rage clicks on a button | Broken or slow interaction, or an off-screen form error | 6, 11, 23 |
| Visitors scroll past pricing and leave | Price surprises or a missing objection answer | 8, 21, 24 |
| Paid traffic converts far worse than email | The landing page doesn’t match the ad | 15 |
| Cart-to-checkout drop is large | Account wall, too many fields, too few payment options | 20, 22 |
| Traffic is up but conversions are flat | Traffic is arriving for the wrong intent | 2, 16 |
The fastest way to improve conversion rate is to work on one leak at a time. Mark your primary key event in GA4 and build one funnel. Install Clarity with consent handled and link it to GA4. Then spend an hour watching recordings of the step with the biggest drop. Fix what you find, check your Core Web Vitals, then pick the next leak and repeat.
It depends on the action and the industry. Unbounce’s 2024 benchmark found a median landing-page conversion rate of 6.6%, with industry medians from about 3.8% to 12.3%. A full ecommerce site converts differently from a single landing page, so compare against your own baseline by device and channel first.
Microsoft says Clarity is free with no traffic limits or sampling. Its script loads asynchronously, and Microsoft says it doesn’t affect page load speed. Still, check your own Core Web Vitals after installing any third-party script.
Google says Core Web Vitals are used by its ranking systems but don’t guarantee top rankings. The stronger case is conversions: Vodafone’s A/B test linked a 31% LCP improvement to 8% more sales, and redBus linked a 72% INP improvement to a 7% sales increase.
Rules vary by province and audience. Quebec’s Law 25 requires technologies that can identify, locate or profile people to be off by default, and Clarity requires explicit consent for visitors from the EEA, UK and Switzerland. Use a consent management platform, and ask privacy counsel how the rules apply to your setup.
More than most people expect. At a 2% baseline, detecting a 20% relative lift needs about 21,000 visitors per variant (95% confidence, 80% power). With less traffic, fix clear problems directly and compare before/after periods.
Consider it when your key pages have enough traffic to run several valid tests a quarter, each conversion is valuable, and you’ve already fixed the obvious problems but don’t know what to test next. If your tracking isn’t reliable yet, fix that first. It’s the cheapest and most valuable step.
About the author: This article was written by the team at 4GoodHosting, a Canadian-owned web hosting company operating since 2002 with data centres in Vancouver and Toronto. This article is a guest contribution to P4 Emachines.
 November 3, 2026Canadian Hosting
 November 2, 2026Business, Ecommerce
 November 2, 2026Hosting, Managed WordPress Hosting Canada, WordPress
 November 2, 2026Business, SEO
 November 2, 2026Hosting, Security & Compliance, WordPress
 November 2, 2026Business, WordPress